A unified credit relative-value workstation, inside Bloomberg.
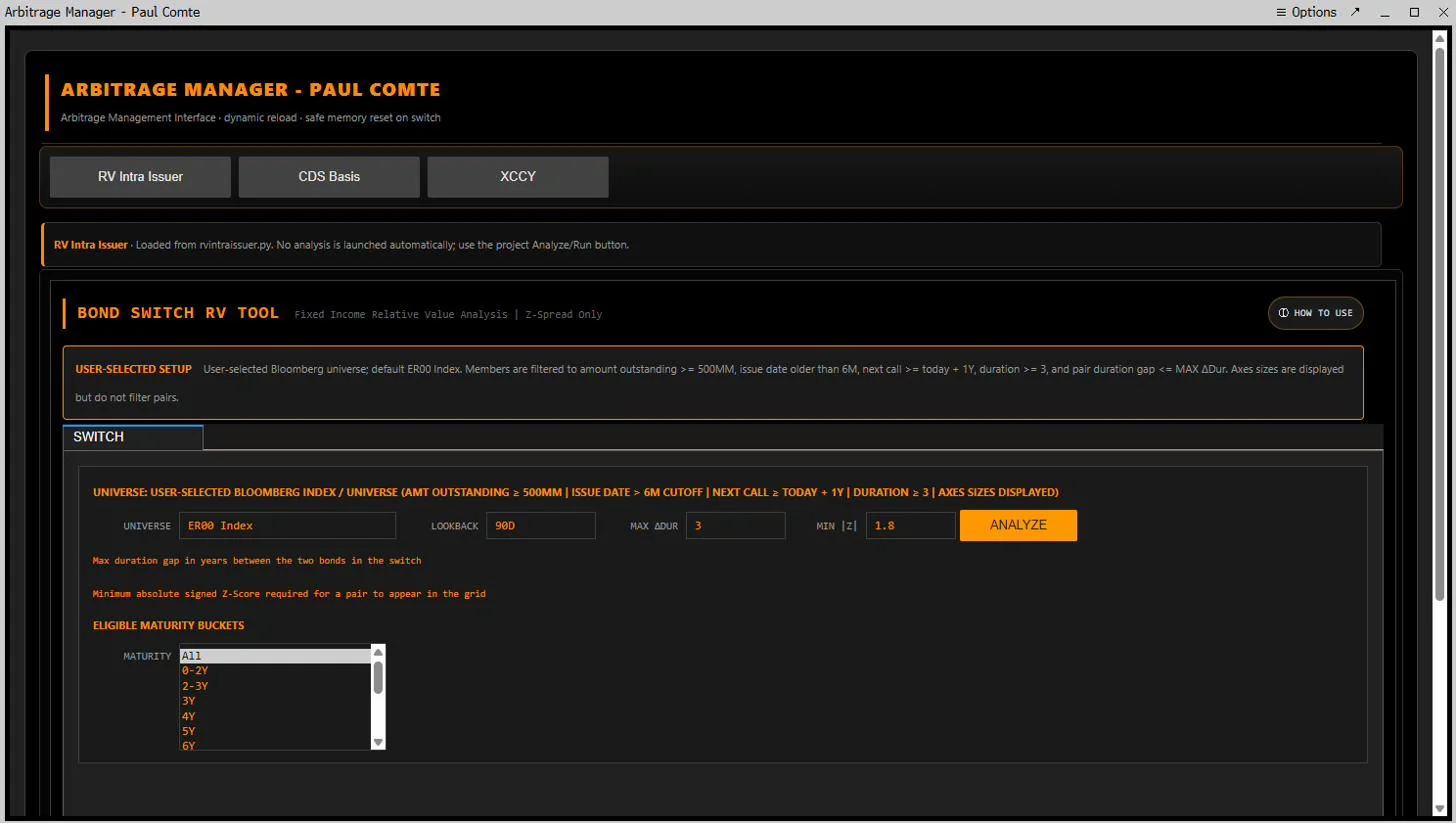
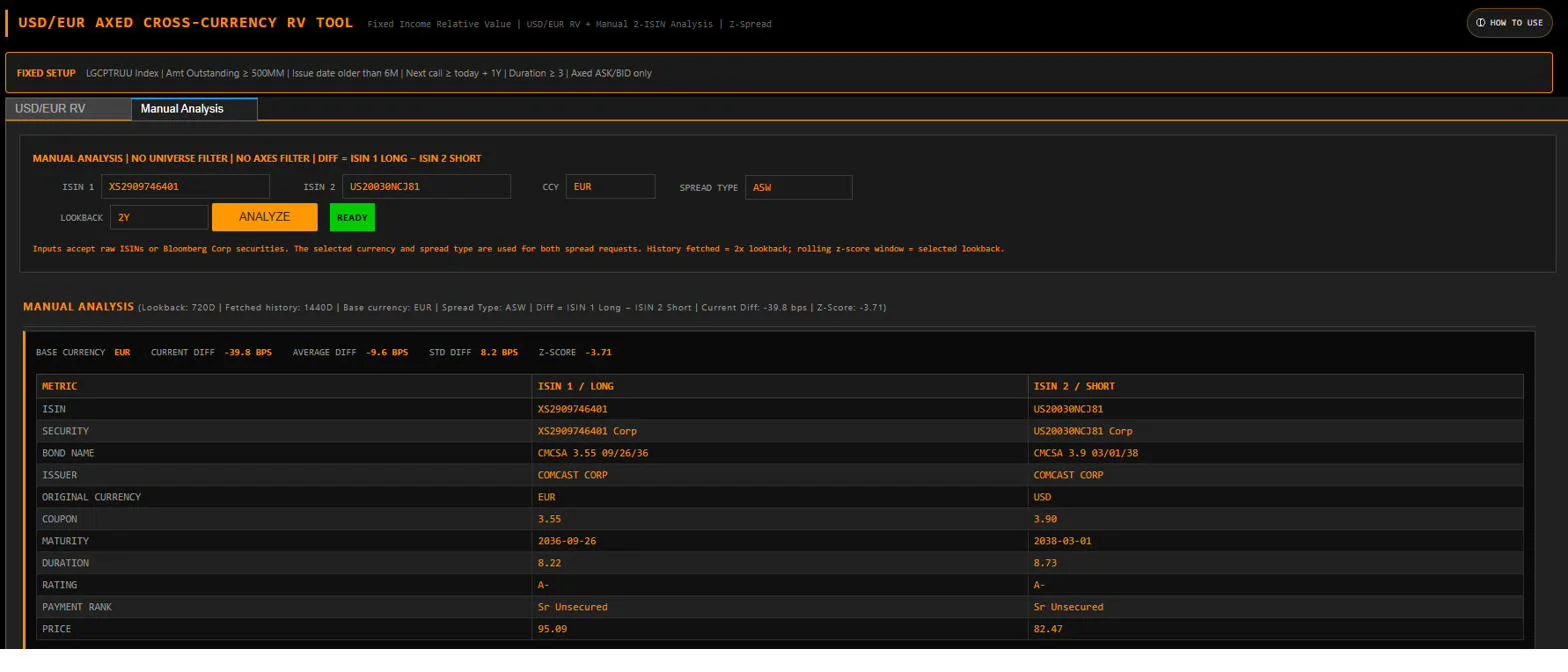
The Arbitrage Manager is a single interface hosting three independent screening engines — intra-issuer switches, bond–CDS basis, and cross-currency — plus a free-form manual pair analyzer. It runs natively in Bloomberg BQuant on BQL data: modules load on demand, and nothing executes until your trader presses Analyze.
RV Intra Issuer
Systematic curve trades within a single issuer.
Point the engine at any Bloomberg index or custom universe (ER00 by default) and it generates every eligible bond pair within the same issuer, after a battery of liquidity, size and structure filters designed to keep only genuinely tradeable candidates.
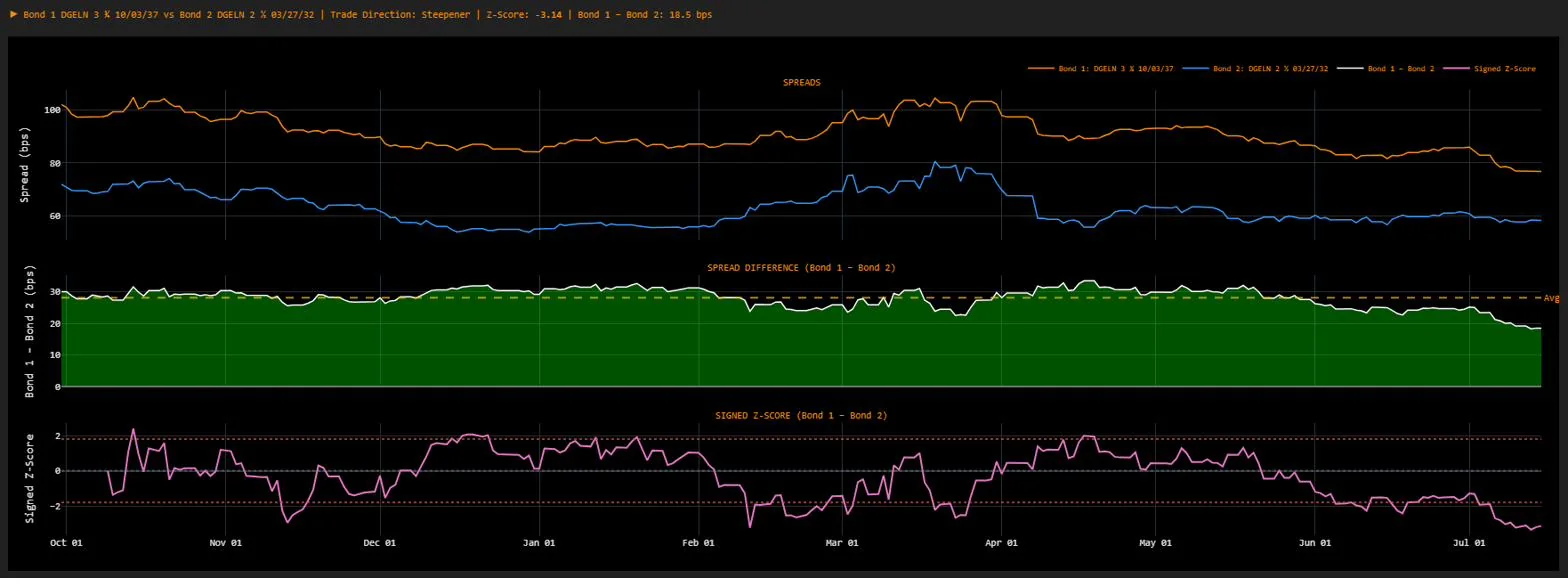
Each pair's spread relationship is tracked through time and scored against its own history. Only the pairs that clear a significance threshold reach the grid, ranked by signal strength and labelled with their trade direction, with live axe sizes attached to both legs, so your trader knows instantly what is actually liftable.
Clicking a row opens the full picture — both spread series, their differential and the signal — and the Open HS link pre-stages the switch in Bloomberg, legs in the right order.
CDS Basis
Cash versus synthetic, measured bond by bond.
For every eligible bond in the universe, the engine reconstructs the issuer's full CDS term structure and measures the gap between cash and synthetic credit at each bond's exact point on the curve.
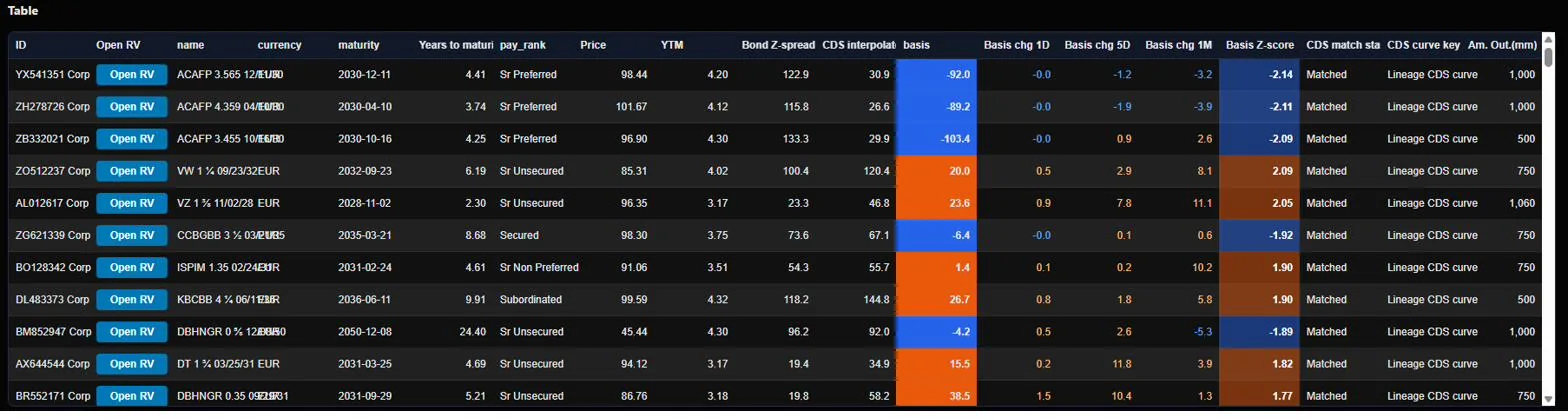
Each bond's basis history is then scored against itself, with short-horizon momentum tracked alongside. A deliberately conservative screening layer filters out statistical noise, so that every line in the final table is a dislocation worth a portfolio manager's minute.
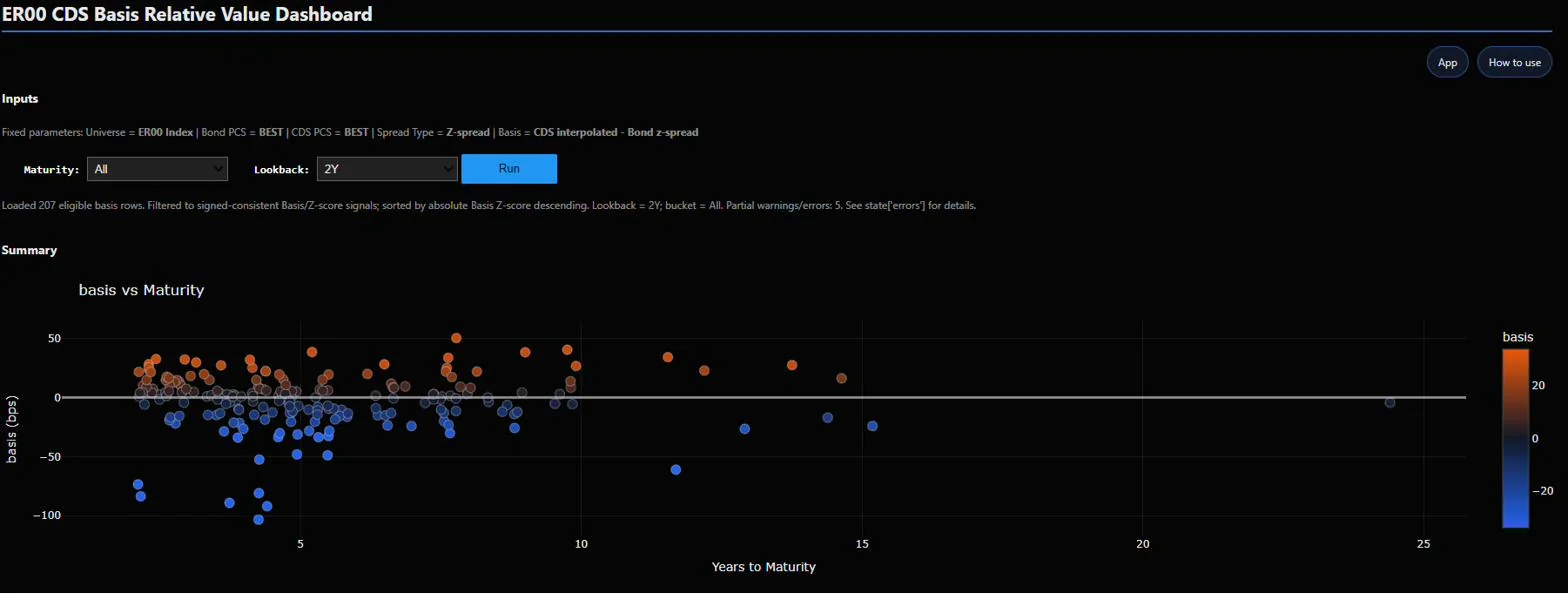
A single scatter summarises the whole universe at a glance — rich versus cheap, across the maturity spectrum — and each row links to the bond's basis history, an animated replay of the issuer's CDS curve, and a one-click Bloomberg RV ticket.
XCCY cross-currency
Funding-currency dislocations, restricted to live axes.
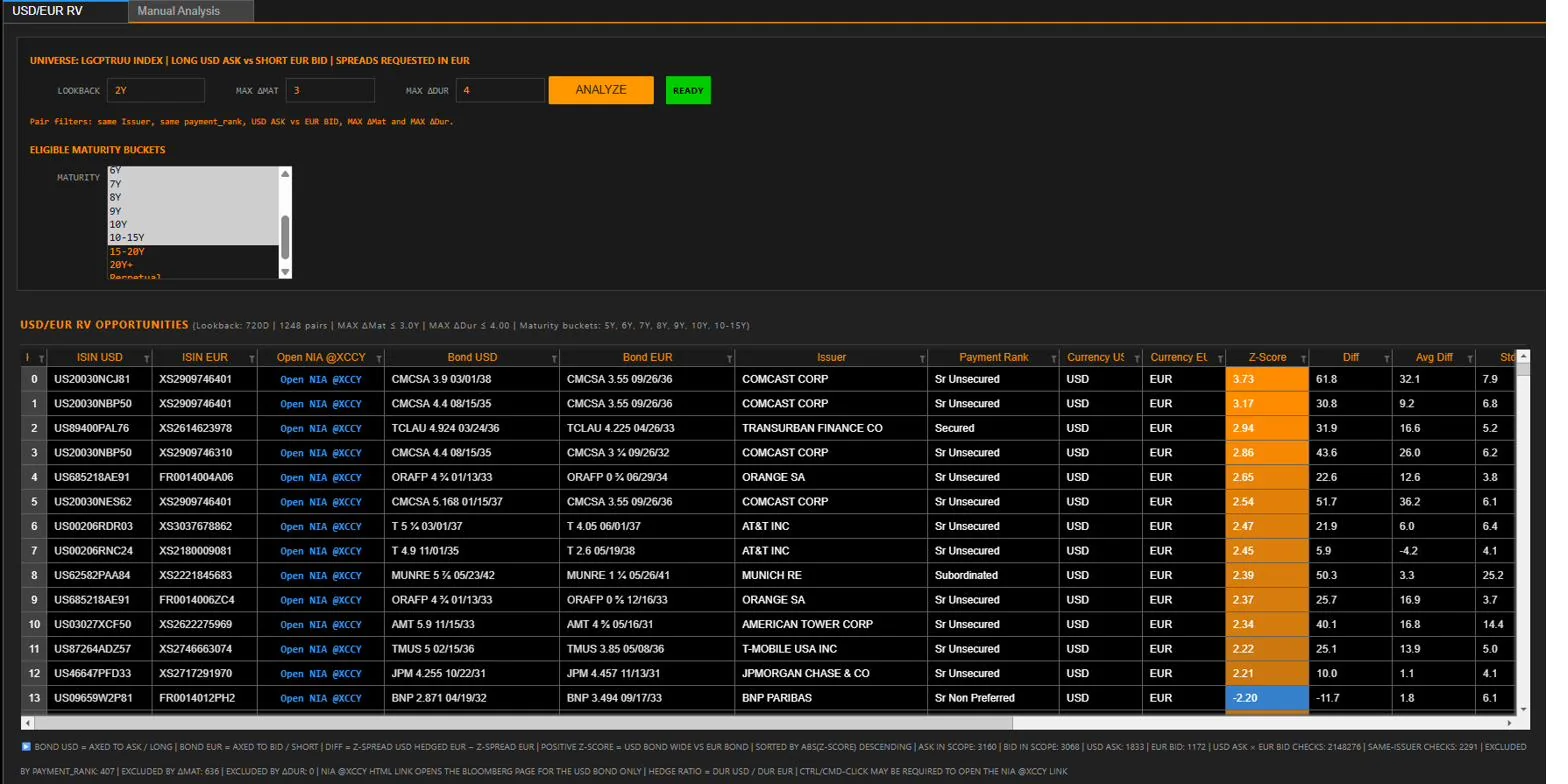
Working from a global credit universe — with an editable reference index, LGCPTRUU by default — the engine pairs USD bonds axed on the offer against EUR bonds axed on the bid from the same issuer and comparable structure: over two million pair checks per run, reduced to a short, ranked list of executable ideas. GBP/EUR is available on the same logic.
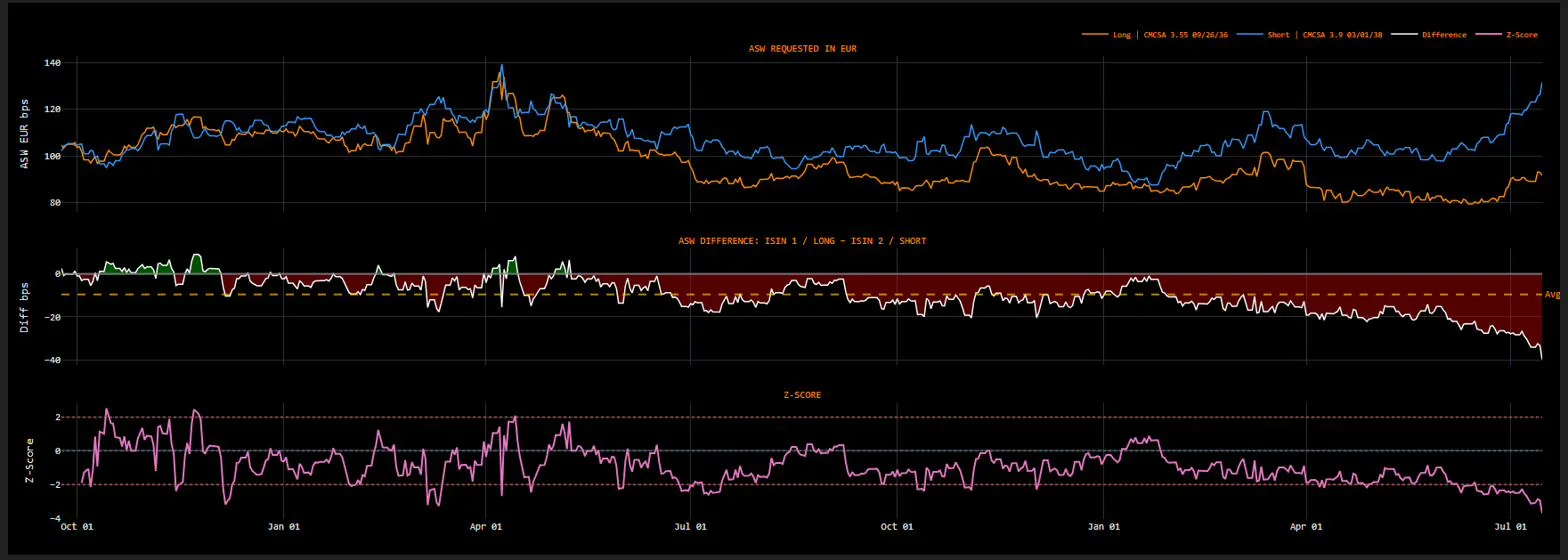
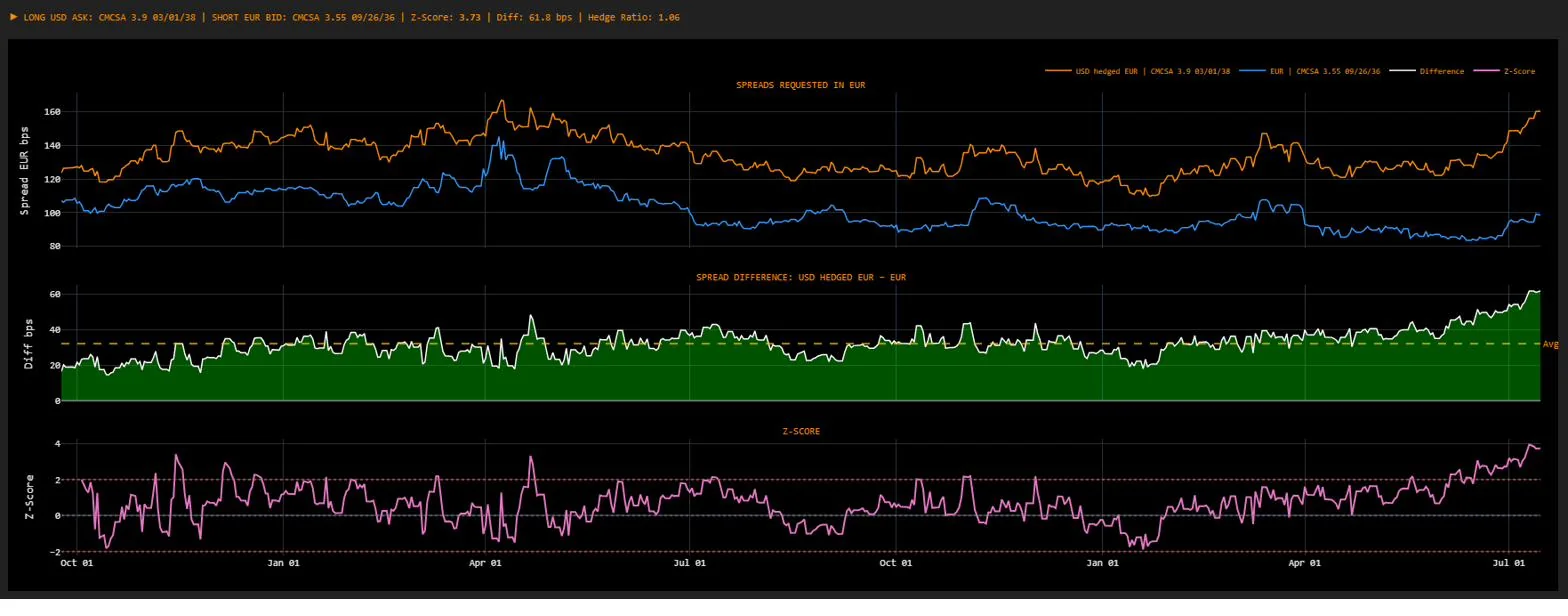
Both legs are expressed in common-currency terms, so the comparison already reflects the cost of the hedge. Each pair is scored against its own history, and the suggested hedge ratio is displayed alongside every signal.
Because the screen is restricted to current live axes, every idea is anchored to inventory dealers are actually showing, not theoretical mid-market marks.
Engineered like production trading software.
Behind the interface, the platform is written to survive the realities of terminal environments and imperfect market data.
Resilient data layer
Bloomberg requests are managed and retried automatically; malformed or partial responses are handled defensively rather than crashing a session mid-morning.
Memory-safe module switching
Switching engines tears down the previous module cleanly and reclaims memory: sessions stay stable all day on a single terminal.
Nothing runs behind your back
No analysis fires automatically. Every run is explicitly triggered, every parameter is visible, and every run's setup is stamped on its output.
Dynamic reload
Updated engine code is picked up on the next module load: new features and client-specific logic ship without reinstalling anything.
Interactive grids and charts
Sortable, filterable data grids with heat-mapped signals; synchronised charts for spreads, differentials and signals on every pair.
Documentation where you need it
Each module carries its own usage guide — universe, controls, conventions — one hover away from the grid, for your traders and your risk team alike.
Tailor-made programs, co-built with your desk.
The Arbitrage Manager is the starting point. CQR works alongside client teams to design bespoke screening and arbitrage programs that reflect how your fund actually operates.
Your internal views, encoded
Programs built around your analysts' recommendations and internal credit views, so systematic screens amplify, rather than ignore, your fundamental work.
Your tradeable universe, exactly
Screens restricted to the issuers and bonds your desk can actually deal: mandate constraints, counterparty lists and liquidity requirements built in.
Statistical × fundamental arbitrage
A hybrid approach mixing statistical dislocation signals with fundamental overlays, producing ideas that are both quantitatively cheap and qualitatively defensible.
See it running on your own universe.
A live walkthrough takes thirty minutes and runs on the indices and issuers your desk actually trades. We also cover the tailor-made programs we co-build with clients.